

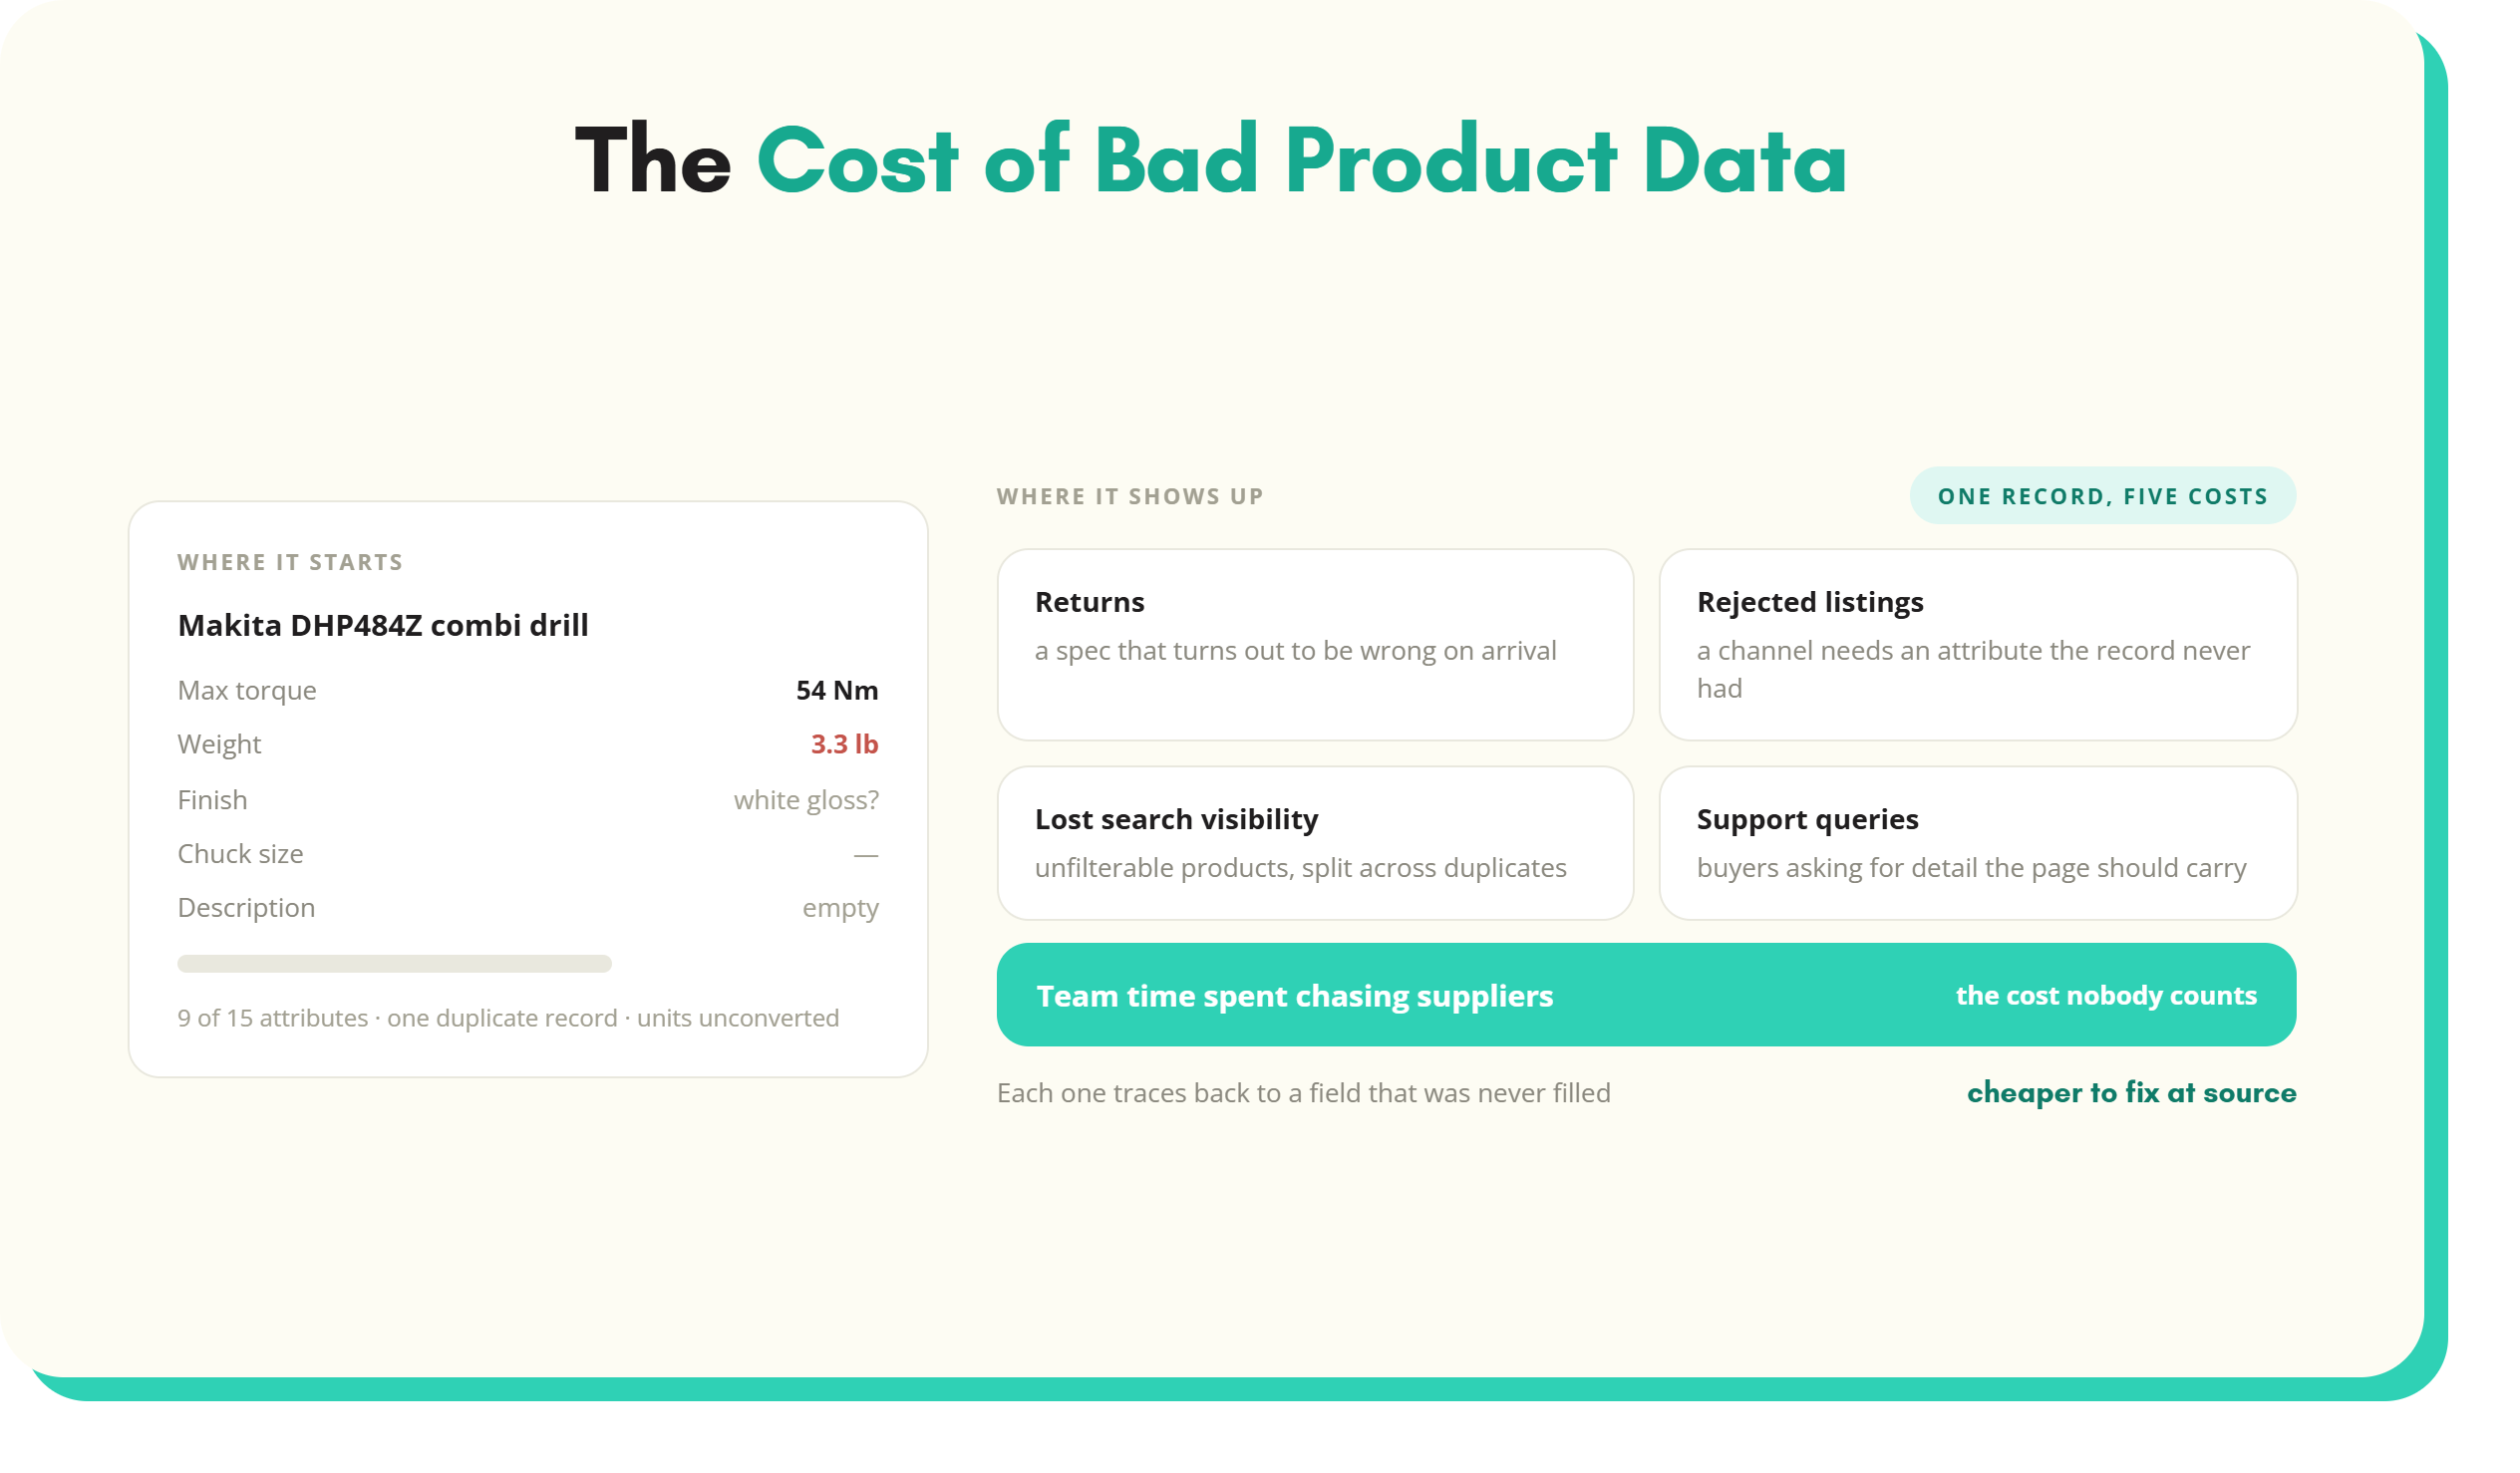
The cost of bad product data is real, but it is spread thin enough that most teams never add it up.
Bad product data does not announce itself. It drains margin in a dozen small places:
- A return here
- An abandoned basket there
- A listing that never ranks
- A buyer who quietly goes to a competitor
The cost of bad product data is real, but it is spread thin enough that most teams never add it up. The 15 statistics below quantify the loss across Europe, North America and Asia Pacific. Each one comes from a named, verifiable source published within the last seven years. Cite them in a business case, a board paper, or an article of your own.
The hidden cost of bad product data
A note on sourcing. Every figure here comes from independent analyst firms, industry associations, official regulators, peer-reviewed work, or established research bodies. None of it comes from product data vendors marketing their own tools, and nothing predates 2019. Where a statistic is a close proxy for the point rather than a direct measure of it, the commentary says so.
The scale is easiest to see at the market level, which is where the list starts. The numbers below break the cost down into the places it lands: the till, the returns desk, the search results, and the catalogue team’s week. Most of these losses trace back to gaps that systematic product data enrichment closes.
The revenue cost of bad product data
1. Poor product data is estimated to cost India’s ecommerce sector around 5,000 crore rupees a year, including roughly 1,900 crore rupees in return-related costs.
Source: GS1 India and Kanvic Consulting, "Uncovering the Hidden Cost of Poor Product Data in Indian E-Commerce", February 2026. gs1india.org
This is the first attempt by a standards body to size the cost of poor product data for an entire APAC market. GS1 traces the loss to gaps in:
- Attributes
- Images
- Descriptions
- Logistics specifications
- Compliance disclosures
For context, 5,000 crore rupees is roughly 475 million pounds, in a single national market. The gaps themselves are not regional. Any European or North American distributor would recognise every one of them in its own supplier feeds.
2. Poor data quality costs the average organisation $12.9 million a year.
Source: Gartner, Data Quality topic page, citing Gartner research, 2021. gartner.com/en/data-analytics/topics/data-quality
This is the most cited number in the field. It covers all enterprise data. Product data is the highest volume, most frequently changed data a retailer or distributor holds, so it carries more than its share of the error rate. Every new supplier line, price change and spec update is another chance for the cost to climb.
3. Companies that grow faster generate around 40 percent more of their revenue from personalisation than slower-growing peers.
Source: McKinsey & Company, "The value of getting personalization right, or wrong, is multiplying" (Next in Personalization), November 2021. mckinsey.com
Personalisation, recommendations and rich product pages all run on structured attributes. You cannot recommend a 10mm fitting to someone who bought an 8mm one when the size sits in a description, not a field. This is a proxy for the conversion value of rich data rather than a direct rich-versus-sparse page test. The mechanism is the same: structured data is what lets a page sell.
4. Consumers say they will pay an average of 9.7 percent more for sustainably produced or sourced goods.
Source: PwC, 2024 Voice of the Consumer Survey, 20,000 consumers across 31 countries, May 2024. pwc.com
The premium only exists on paper until the product data substantiates it. Certifications, materials, origin and carbon claims all have to be captured as attributes, verified, and displayed at the point of sale. A sustainability claim with no supporting product data cannot be charged for, and European rules on green claims are tightening. PwC also notes the stated premium does not always convert to spend, so treat this as the ceiling, not the floor.
Customer experience and product data accuracy
5. US shoppers returned about $890 billion of merchandise in 2024, roughly 16.9 percent of sales.
Source: National Retail Federation and Happy Returns, "2024 Consumer Returns in the Retail Industry", December 2024. nrf.com/research/2024-consumer-returns-retail-industry
Not all of that is data driven, but a clear share is. The GS1 India study above attributes roughly 1,900 crore rupees of loss to returns caused by poor product data in one market alone. A return is the most expensive form of feedback: you lose the sale and pay the reverse logistics to get the item back. When the product is fine and only the data describing it is wrong, that cost is entirely avoidable.
6. European retailers were found to underestimate their own return rates by an average of more than 80 percent.
Source: ECR Retail Loss Group, "Buy Online Return in Store", 2020. ecrloss.com
The study, built on case work with major UK and European retailers, found none had a clear picture of what returns cost. One retailer understated its return rate by 150 percent. The same research found a 5 percent improvement in returns can deliver a 200 basis point improvement in net margin. A cost that is undermeasured is a cost that goes unfixed. The share of returns caused by wrong product data is the most fixable part of it.
7. The global value of returned goods has reached $1.9 trillion, and 91 percent of retailers say returns costs are growing faster than their sales.
Source: IHL Group, retail research findings, 2026. ihlservices.com
Returns processing costs have also risen 40 percent since 2020, according to the same research. Rising labour and freight costs explain part of that. Every return triggered by a wrong dimension or a misleading image pays those inflated costs for no reason.
8. 44% of ecommerce sites do not display the returns policy on the product page, where around 60 percent of consumers look for it.
Source: Baymard Institute, product page and returns UX research, continuously updated. baymard.com/research
Baymard’s apparel audits also find the large majority of sites fail to provide sufficient sizing information. Size and fit sit at the top of stated return reasons, well ahead of damage or defects. That makes missing product information a returns generator: the shopper guesses, the guess is wrong, and the retailer pays the reverse logistics. The cheapest return is the one the product page prevented.
Operations: the cost of manual data work
9. An average of 30 percent of total enterprise time is spent on non-value-added tasks because of poor data quality and availability.
Source: McKinsey & Company, "Designing data governance that delivers value", reporting its 2019 global data survey, June 2020. mckinsey.com
In a product team this is:
- The analyst rekeying a supplier spreadsheet
- The merchandiser chasing a missing weight
- The ecommerce manager reading a description twice before it goes live
None of it adds value to the customer. Across a team maintaining tens of thousands of SKUs, nearly a third of everyone’s time is a set of salaries spent on rework. Automating extraction through AI product data extraction is how that time gets reclaimed.
10. 82 percent of organisations spend one or more days per week resolving data quality issues.
Source: McKinsey & Company, Master Data Management survey, published in Rewired, 2023. mckinsey.com
The same research found 72 percent of leading organisations consider data management a major barrier to scaling impact. In a catalogue, that weekly firefighting is the queue of wrong dimensions, missing materials and miscategorised parts waiting for a human to notice them. This is a proxy for support and contact volume, which has no clean independent figure. But it sizes the upstream cause: for most organisations, fixing faulty data is a standing weekly appointment. Validating supplier data at submission, through supplier onboarding software, is how that appointment gets shorter.
SEO and discoverability
11. 36% of top-grossing ecommerce sites have design and feature flaws severe enough to actively harm users’ ability to find and select products.
Source: Baymard Institute, large-scale ecommerce UX benchmarking of 123 top US and European sites, continuously updated. baymard.com/research
Findability is the front end of discoverability. If a third of major sites cannot surface the right product to a shopper already looking for it, the problem is rarely the search box. It is the data behind it. Thin or inconsistent attributes give the search and category logic nothing to work with. This is a proxy for organic traffic impact, which has no clean independent figure. But on-site discoverability and search discoverability fail for the same reason.
12. Only around 16% of ecommerce sites deliver an effective faceted search and filtering experience.
Source: Baymard Institute, ecommerce search and filtering usability research, continuously updated. baymard.com/research
Faceted search only works when products carry complete, consistent attributes. You cannot offer a filter for voltage, thread size or material if those values are missing on half the range. The low adoption figure is a data-completeness figure in disguise: most sites cannot build good filters because the underlying product data will not support them.
13. Product lists with poor usability see abandonment rates of 67 to 90%, against 17 to 33% for well-structured ones.
Source: Baymard Institute, product list and category usability research, continuously updated. baymard.com/research
The product list is where a shopper decides whether to keep going or leave. A list built on complete attributes can be sorted, filtered and compared. A list built on sparse data cannot, and the abandonment numbers show the difference is not marginal. The gap between a third walking away and nine in ten walking away is largely the gap between complete and incomplete product data.
Marketplace and compliance
14. Marketplaces account for roughly two-thirds of global online sales, and the top 100 sold $3.83 trillion of goods in 2024.
Source: Digital Commerce 360, Global Online Marketplaces research, 2024 to 2025. digitalcommerce360.com
China’s Taobao, Tmall and JD.com alone account for 62 percent of top-100 third-party sales. That makes marketplace data standards the default trading environment across APAC, and increasingly everywhere else. Marketplaces enforce standards most internal catalogues never had to meet:
- Mandatory attributes
- Controlled values
- Image specifications
Data that passed internally gets rejected at the gate. Clean classification, through ETIM mapping software and similar standards, is what gets a listing accepted first time on Amazon, Mirakl or a GDSN pool.
15. EU authorities issued a record 4,137 alerts for dangerous products in 2024, and new EU rules now require full product traceability.
Source: European Commission, Safety Gate annual report for 2024, published April 2025. commission.europa.eu
Alerts have almost doubled since 2022. The General Product Safety Regulation, in force since December 2024, requires traceability for online sales and faster, more consumer-friendly recalls. In regulated verticals a data error is not a conversion problem, it is a compliance one. Accurate, traceable product data lets a company identify exactly which items are affected. It is also what keeps a listing legal in the European market.
What to do about the cost of bad product data
The pattern across these 15 statistics is consistent. Bad product data costs money:
- At the point of sale
- At the returns desk
- In the warehouse
- In the search results
- In the time of the people who maintain the catalogue
None of it appears as a single line, which is exactly why the cost of bad product data survives unchallenged.
Manual checking does not fix it, because the data quality figures above show that records arrive faster and more flawed than people can correct them. The durable answer is to get data right at the point it enters the catalogue. That is the work of product data enrichment: turning messy supplier inputs into structured, complete, validated attributes before they ever reach a customer.
For distributors carrying tens of thousands of technical SKUs, product data management for distributors is where the returns, abandonment and discoverability numbers get pulled back.
If you are building the business case these figures support, the cost side is on this page. The return side comes from closing the gaps the statistics describe, one supplier feed at a time. A structured way to model that return is set out in the guide to product data enrichment ROI. The customer case studies show what the shift looks like in practice.
Key takeaways
- The cost of bad product data is distributed across returns, abandonment, rework, lost discoverability and compliance risk, which is why it rarely appears as a single line on the profit and loss.
- The macro evidence is independent and regional: GS1 puts the cost of poor product data at 5,000 crore rupees a year in India alone, and Gartner puts poor data quality at $12.9 million per organisation.
- Returns are the clearest cost on every continent: $890 billion in the US in 2024, $1.9 trillion globally, with European retailers underestimating their return rates by over 80 percent.
- Discoverability fails on thin data: only about 16 percent of sites offer effective faceted search, and poorly structured product lists are abandoned up to 90 percent of the time.
- The operational drag is measurable: 30 percent of enterprise time lost to poor data, and 82 percent of organisations fixing data quality issues at least one day a week.
- Every figure comes from a named, verifiable source published within the last seven years, ready to cite in a business case, a board paper or an article.
See where these numbers hide in your own catalogue
The figures above are industry wide. The ones that matter are yours: your return rate, your abandoned baskets, your hours spent fixing supplier data. SKULaunch enriches messy supplier inputs into structured, accurate product data before it reaches a customer. Book a demo to size the gap in your data.
See it in practice: audit catalogue quality before a PIM go-live, fix Amazon listings suppressed for missing attributes and measure product data completeness by category and channel.
See SKULaunch in action
Watch how we handle AI enrichment, supplier onboarding, and catalogue scale in a live 30-minute demo.


.avif)